
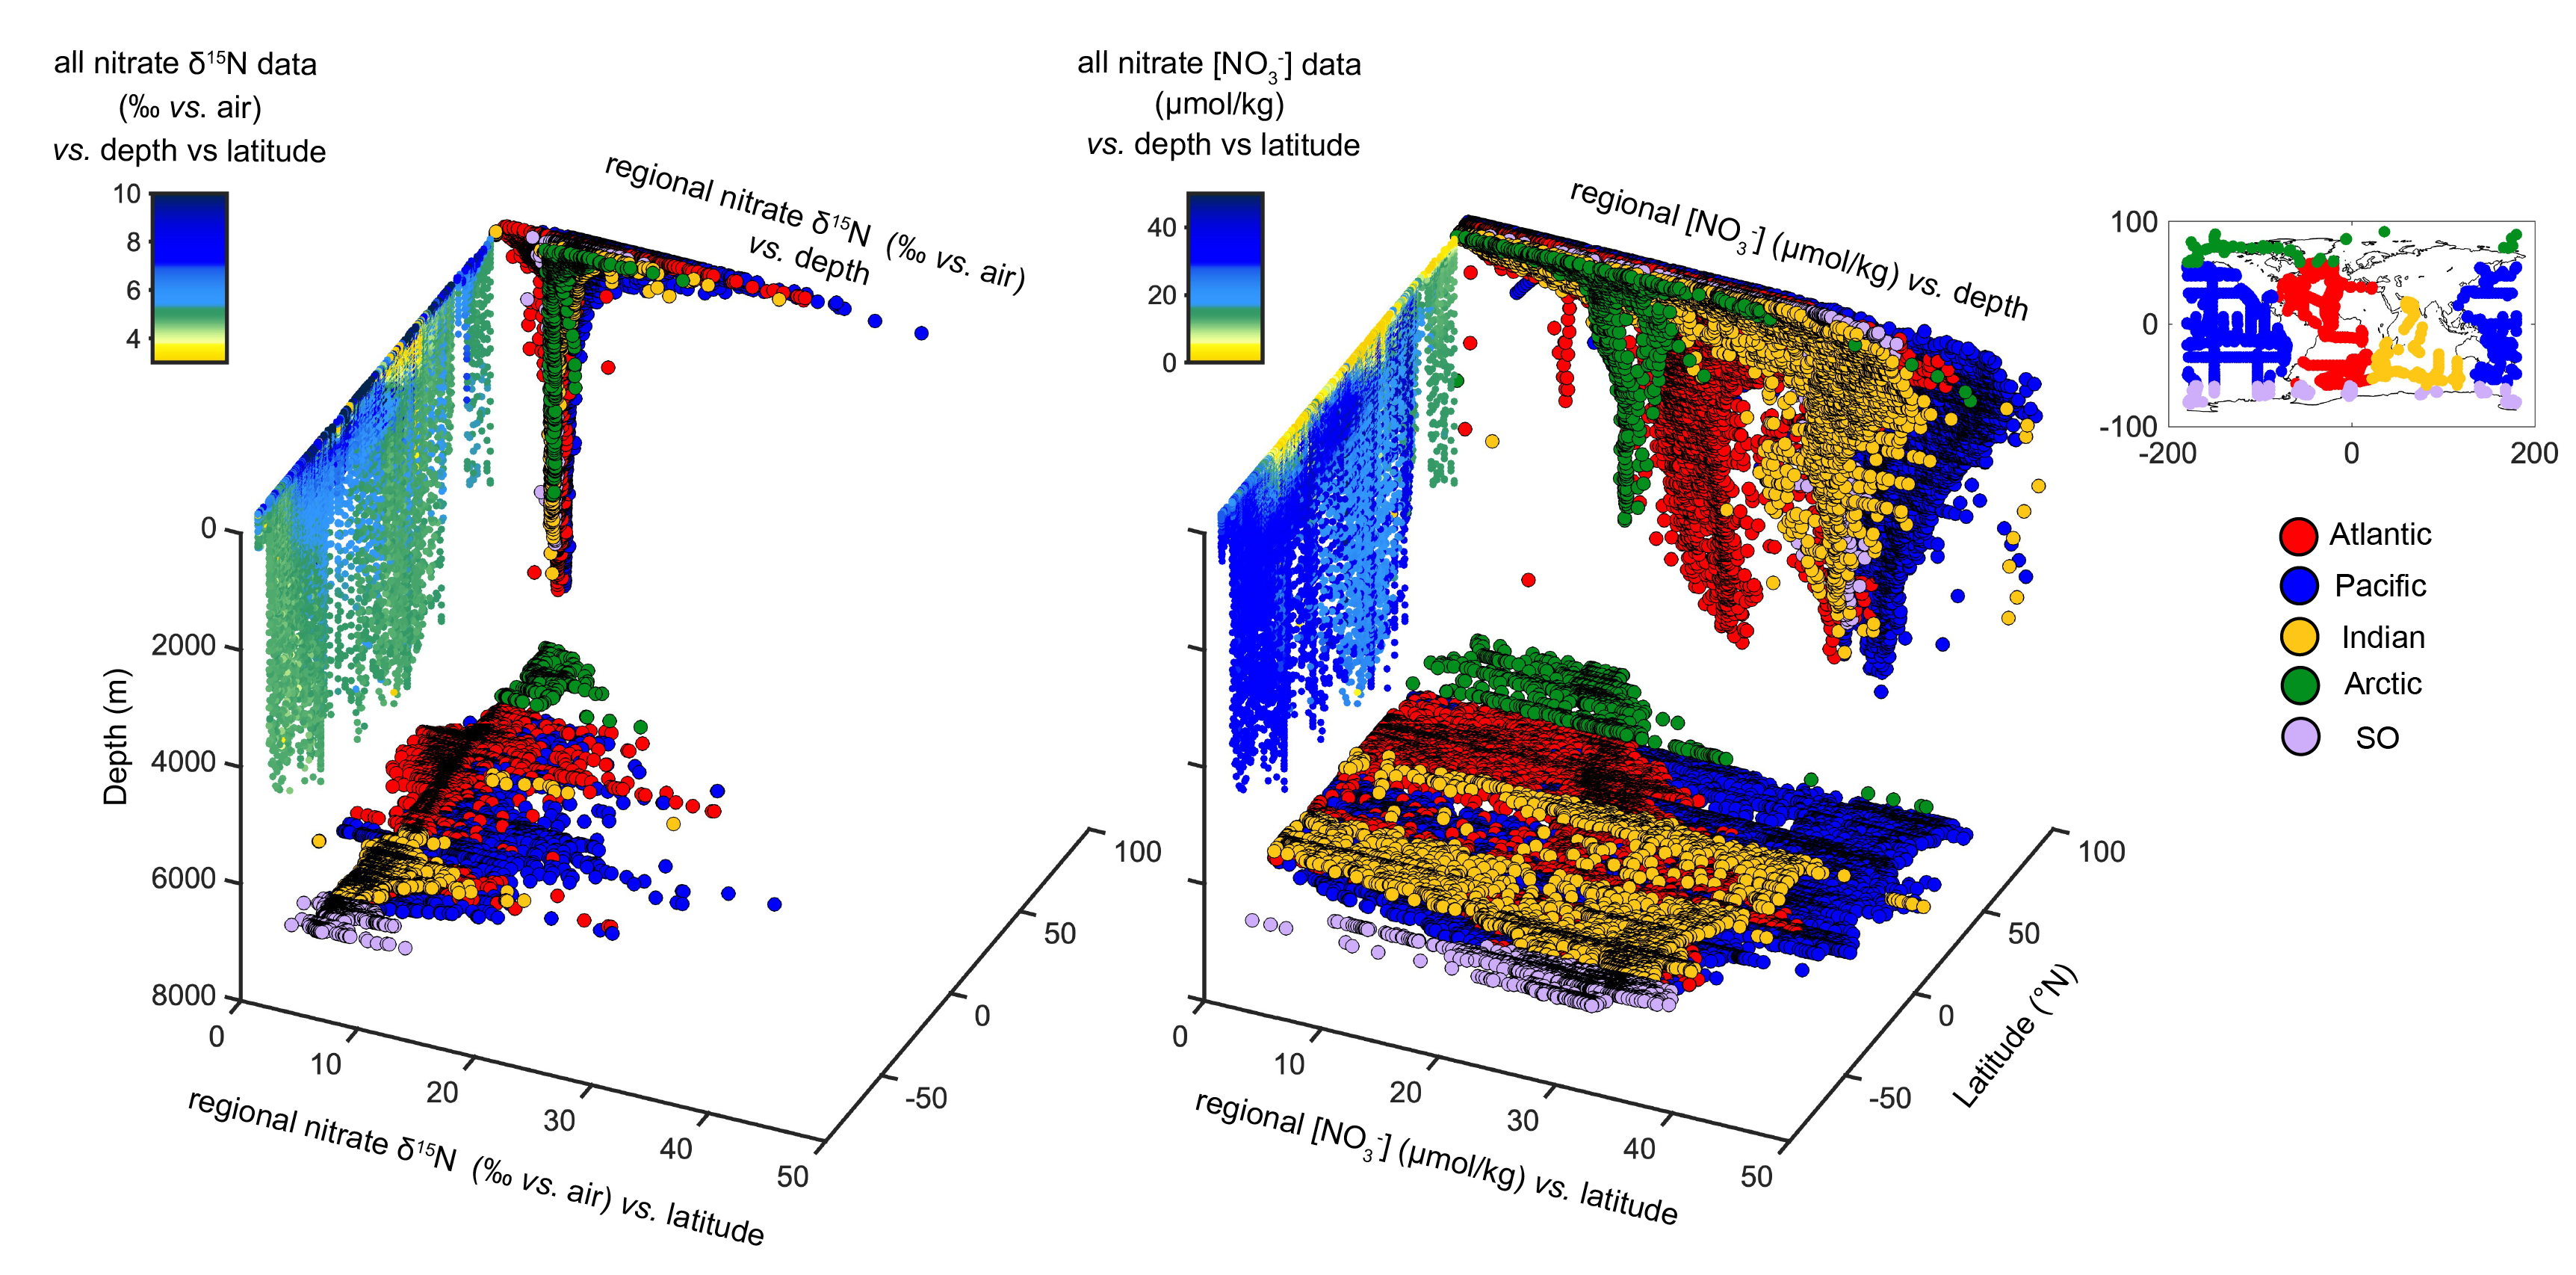
3D view of nitrate δ15N (‰ vs. air) (left) and concentration (μM) (right) versus latitude (°N) and depth (m) for all the data included in the compilation. The x-axis reflects nitrate δ15N (left) and concentration (right) both displayed as circles with a black outline. The y-axis reflects latitude, and the z-axis reflects depth. The colors of the circles and squares shown in the xy and xz plots are used to sort the data into five oceanic regions (red for the Atlantic Ocean, blue for the Pacific Ocean, yellow for the Indian Ocean, green for the Arctic Ocean and purple for the Southern Ocean). Blue, green, and yellow dots displayed on the yz panels indicate nitrate δ15N (left) and nitrate concentration (right) depth distributions of all data across latitude (see colorbars in the top-left part of each panel).
Mean ocean nitrate concentration and δ15N are 22.80 μM and 6.05‰ (n=27154), respectively. Mean nitrate concentration and δ15N are 16.2 μM and 5.40‰ in the Atlantic Ocean (n=7513), 26.28 μM and 6.73‰ in the Pacific Ocean (n=12715), 23.05 μM and 6.20‰ in the Indian Ocean (n=3084), 29.12 μM and 5.33‰ in the Southern Ocean (n=2021) and 12.78 μM and 6.08‰ in the Arctic Ocean (n=866), respectively.